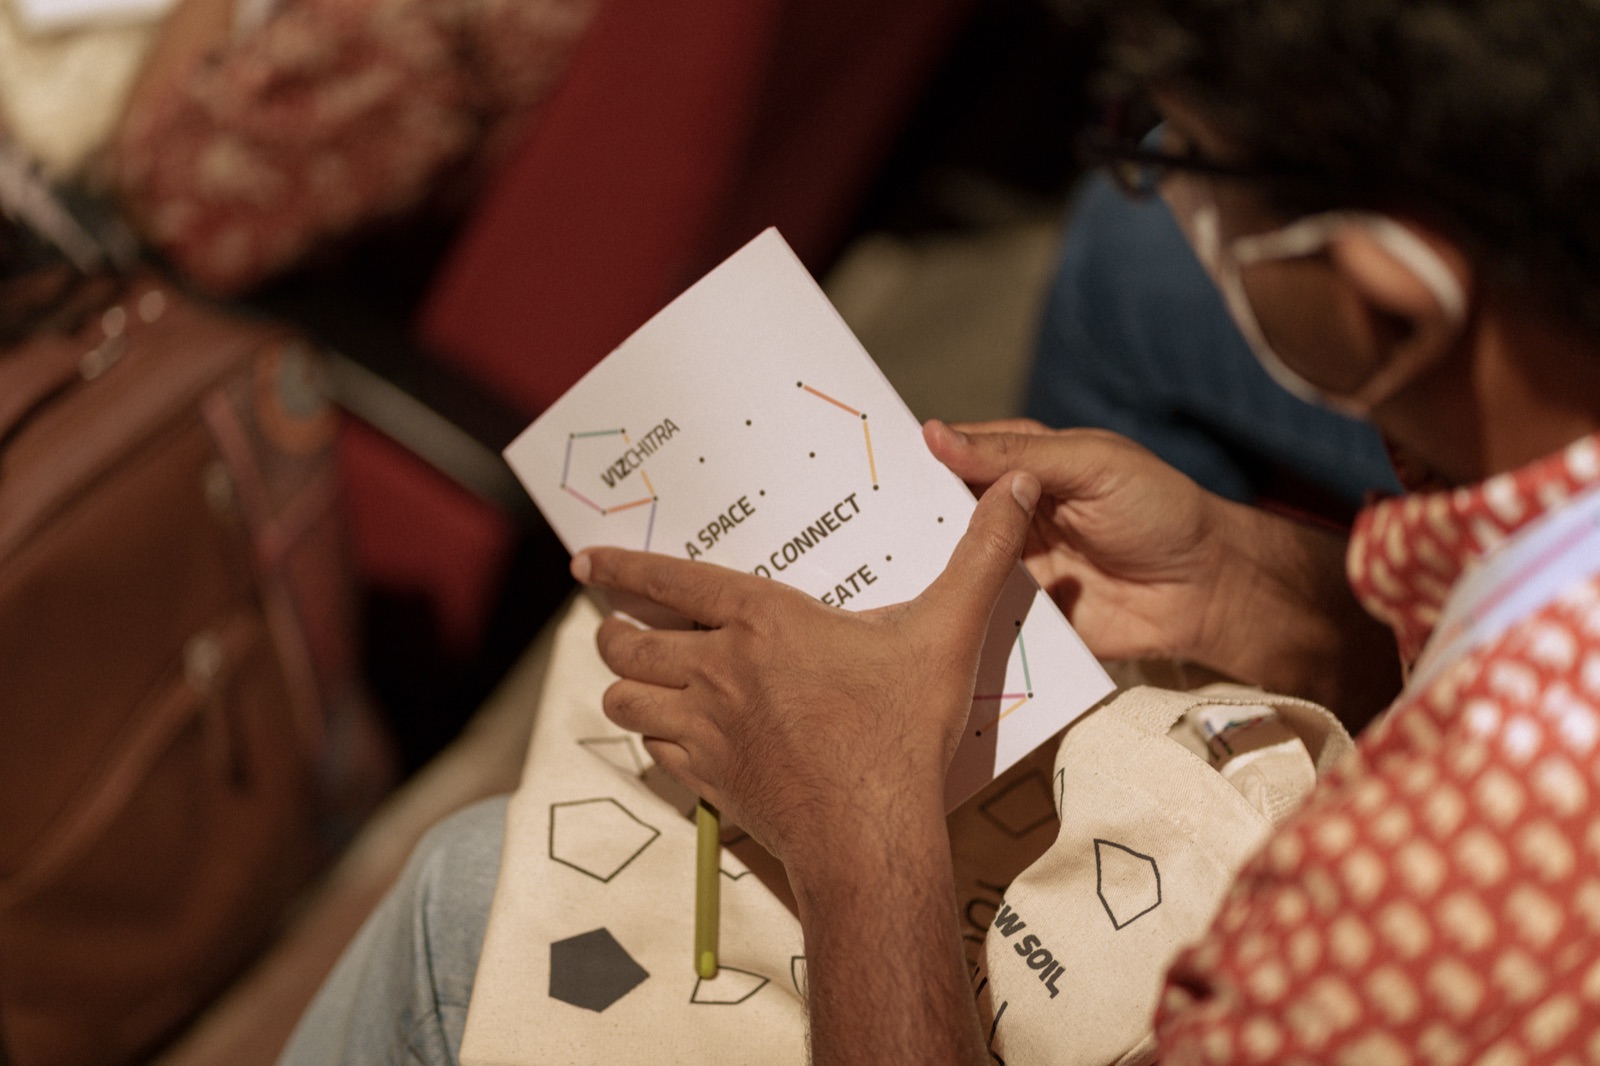
VIZCHITRA
Workshops
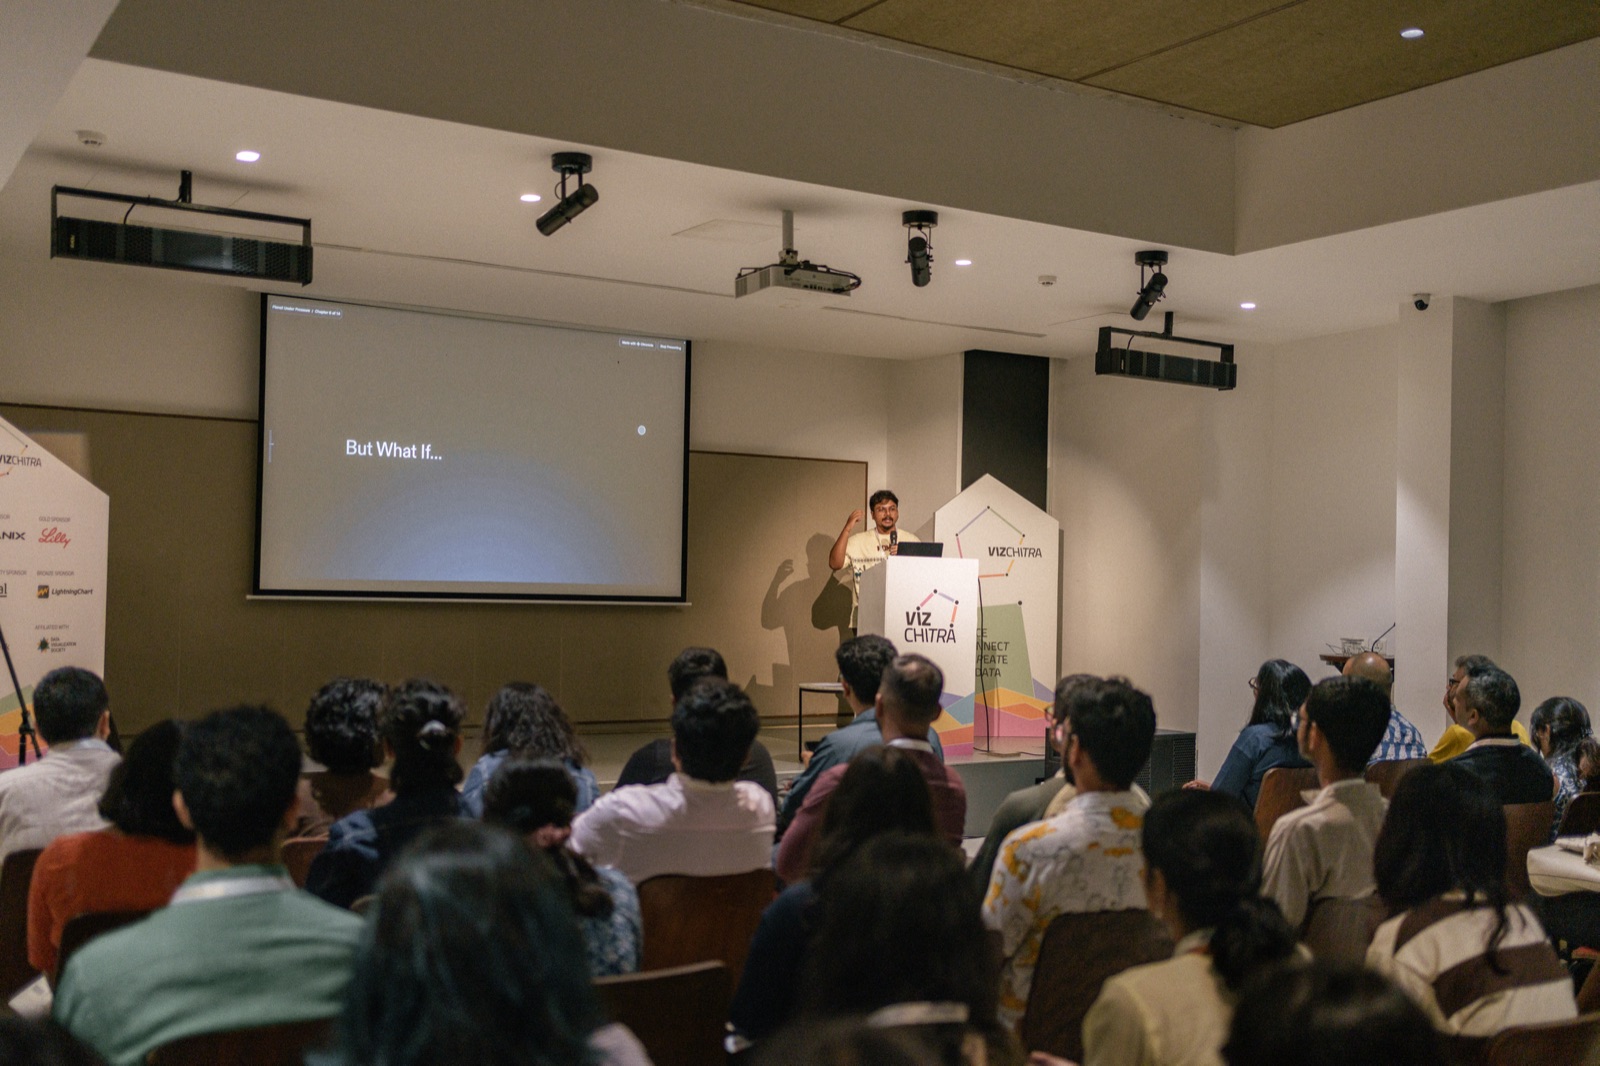
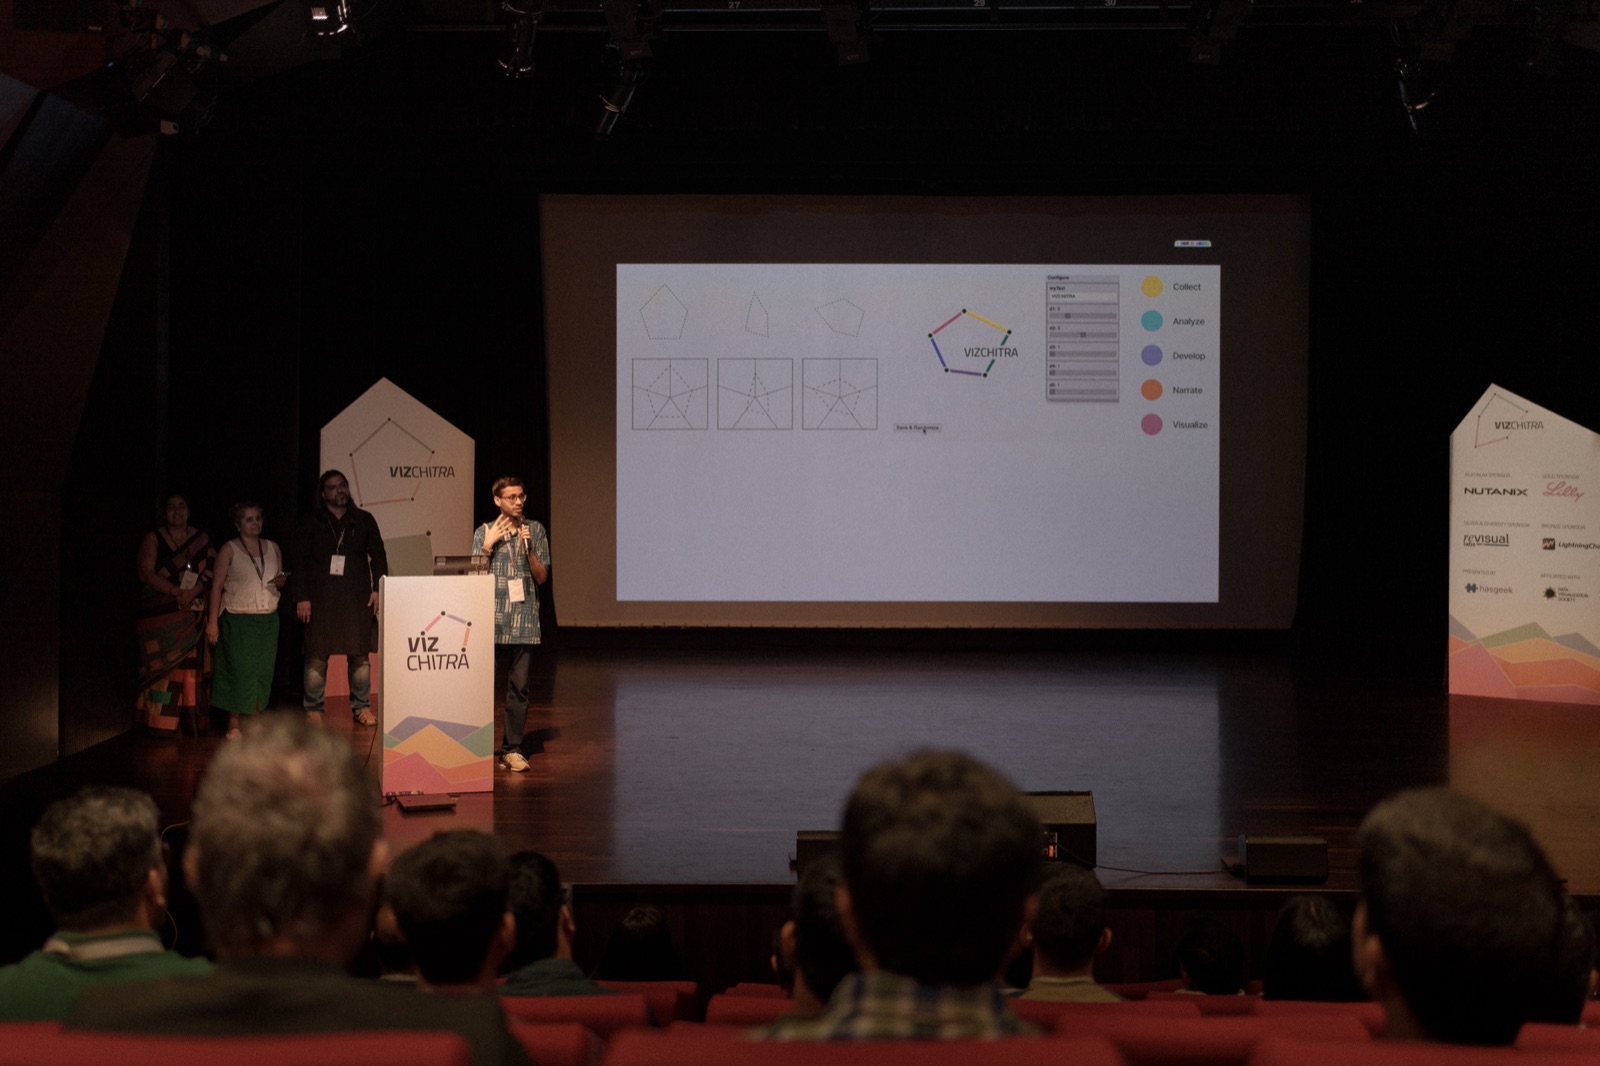
Agentic DataViz: Build Systems, Not Charts
Find the Story. Teach the Agent. Run It Again.
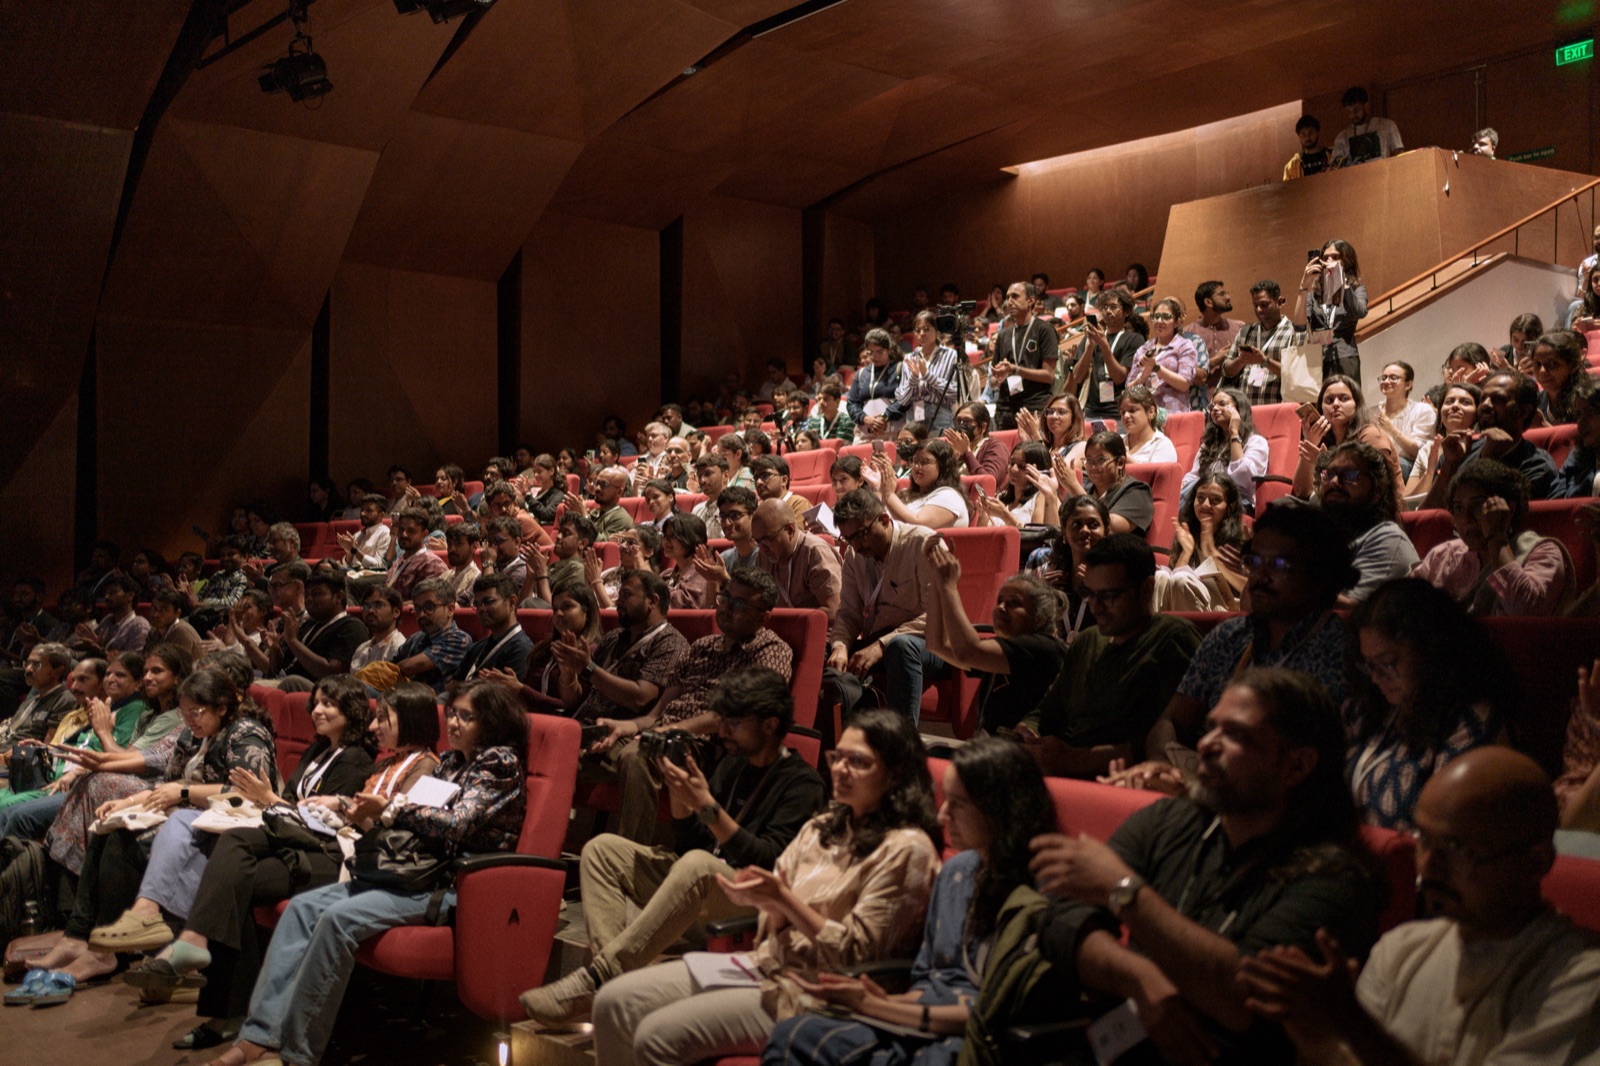
Join us for talks, workshops, dialogues, and an exhibition.
Two days of data visualization, curated by India's data viz community —
in person in Bengaluru, or online from anywhere.
The livestream is for ticket holders.
Not attending but want to back VizChitra? Contribute any amount →
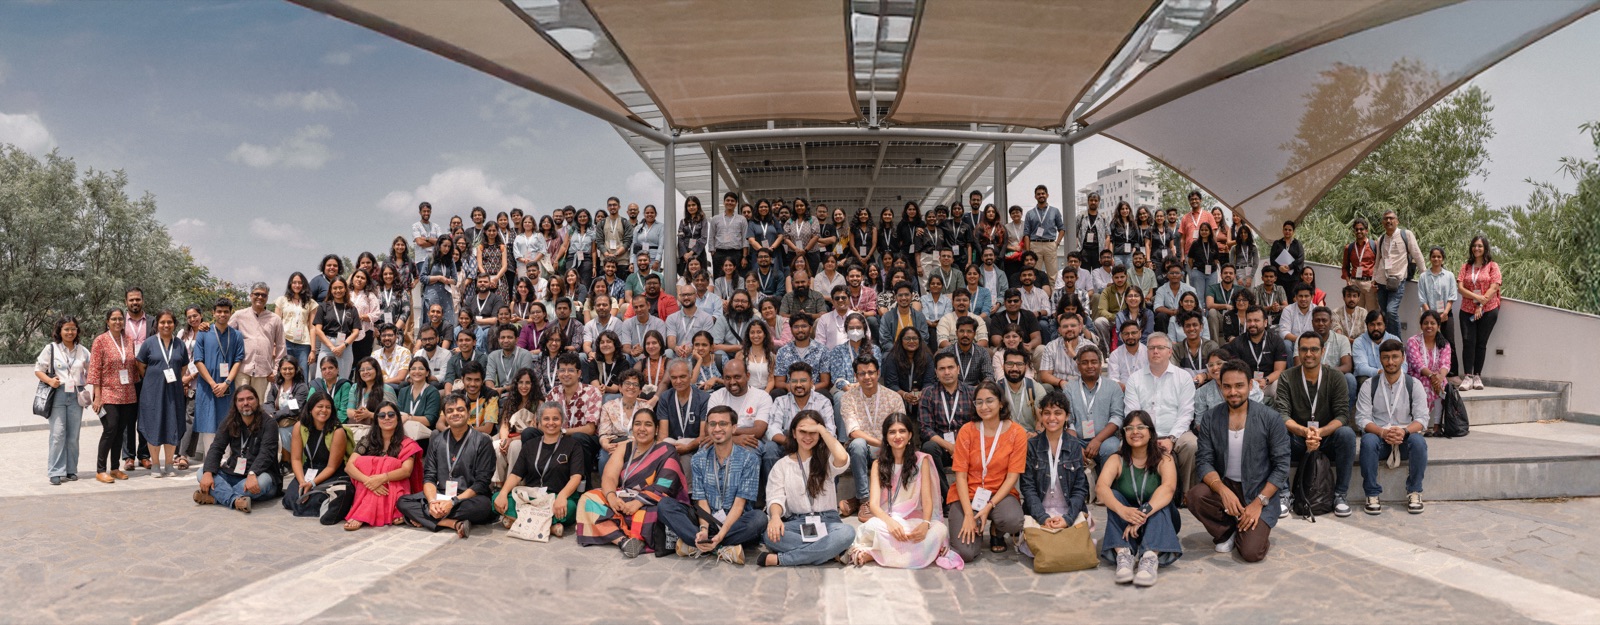

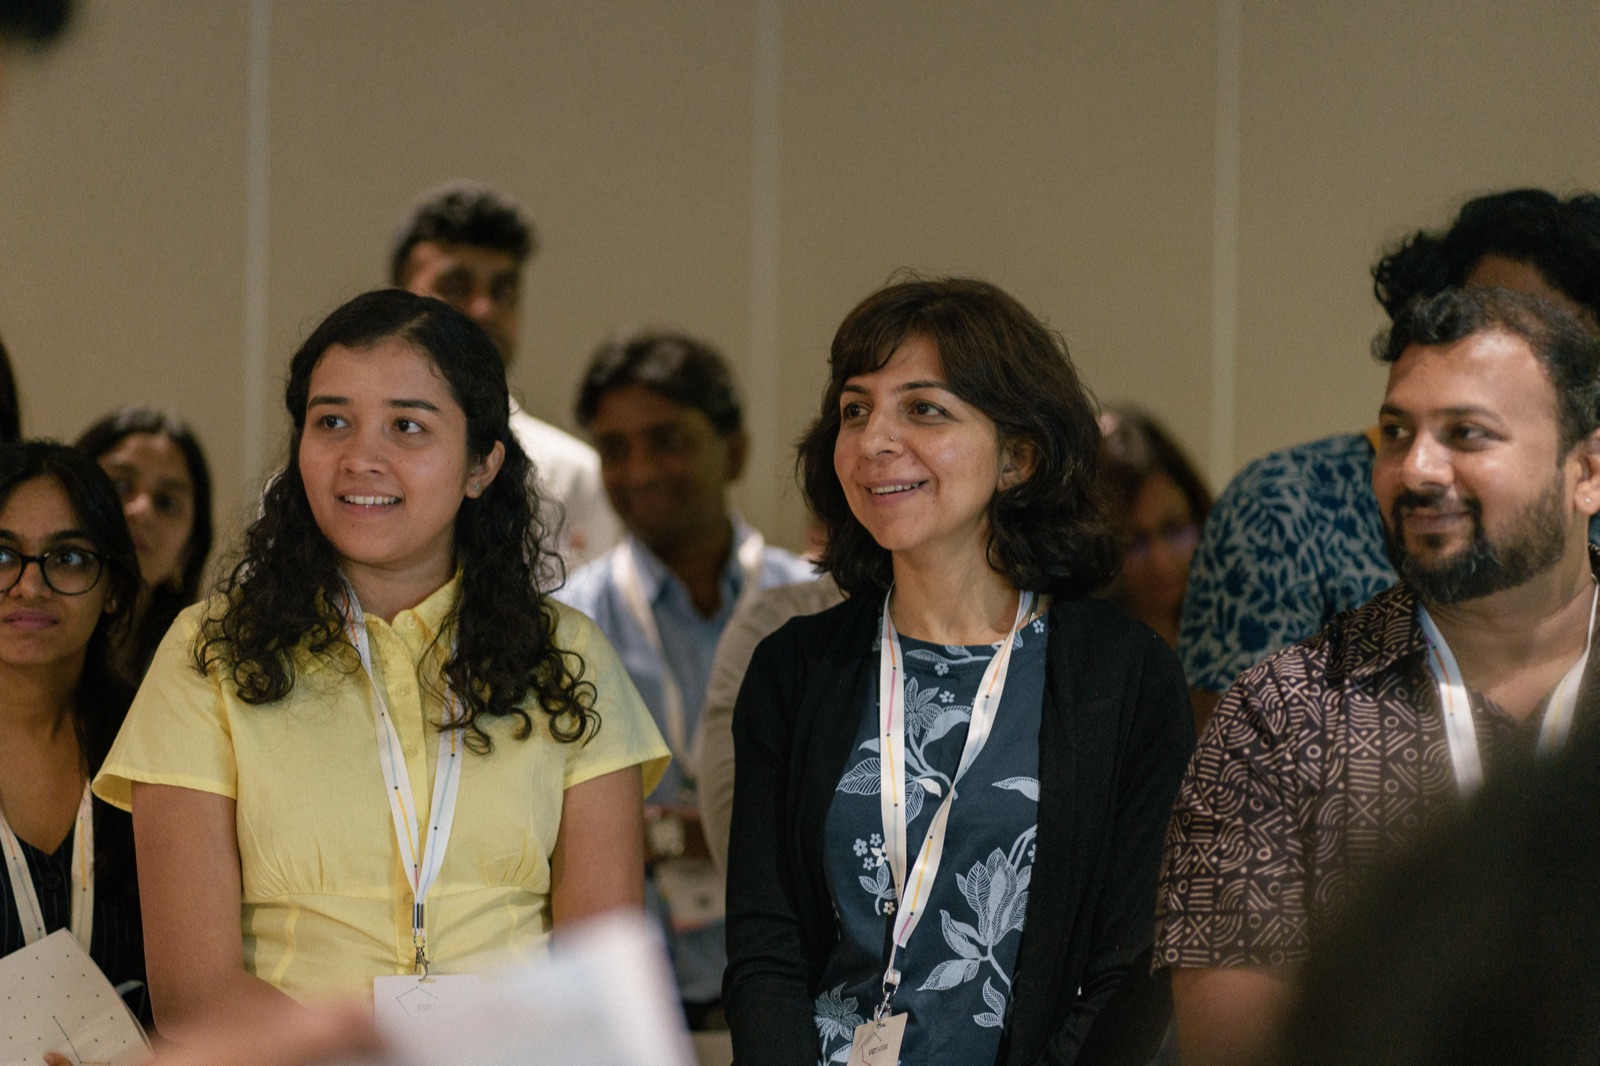
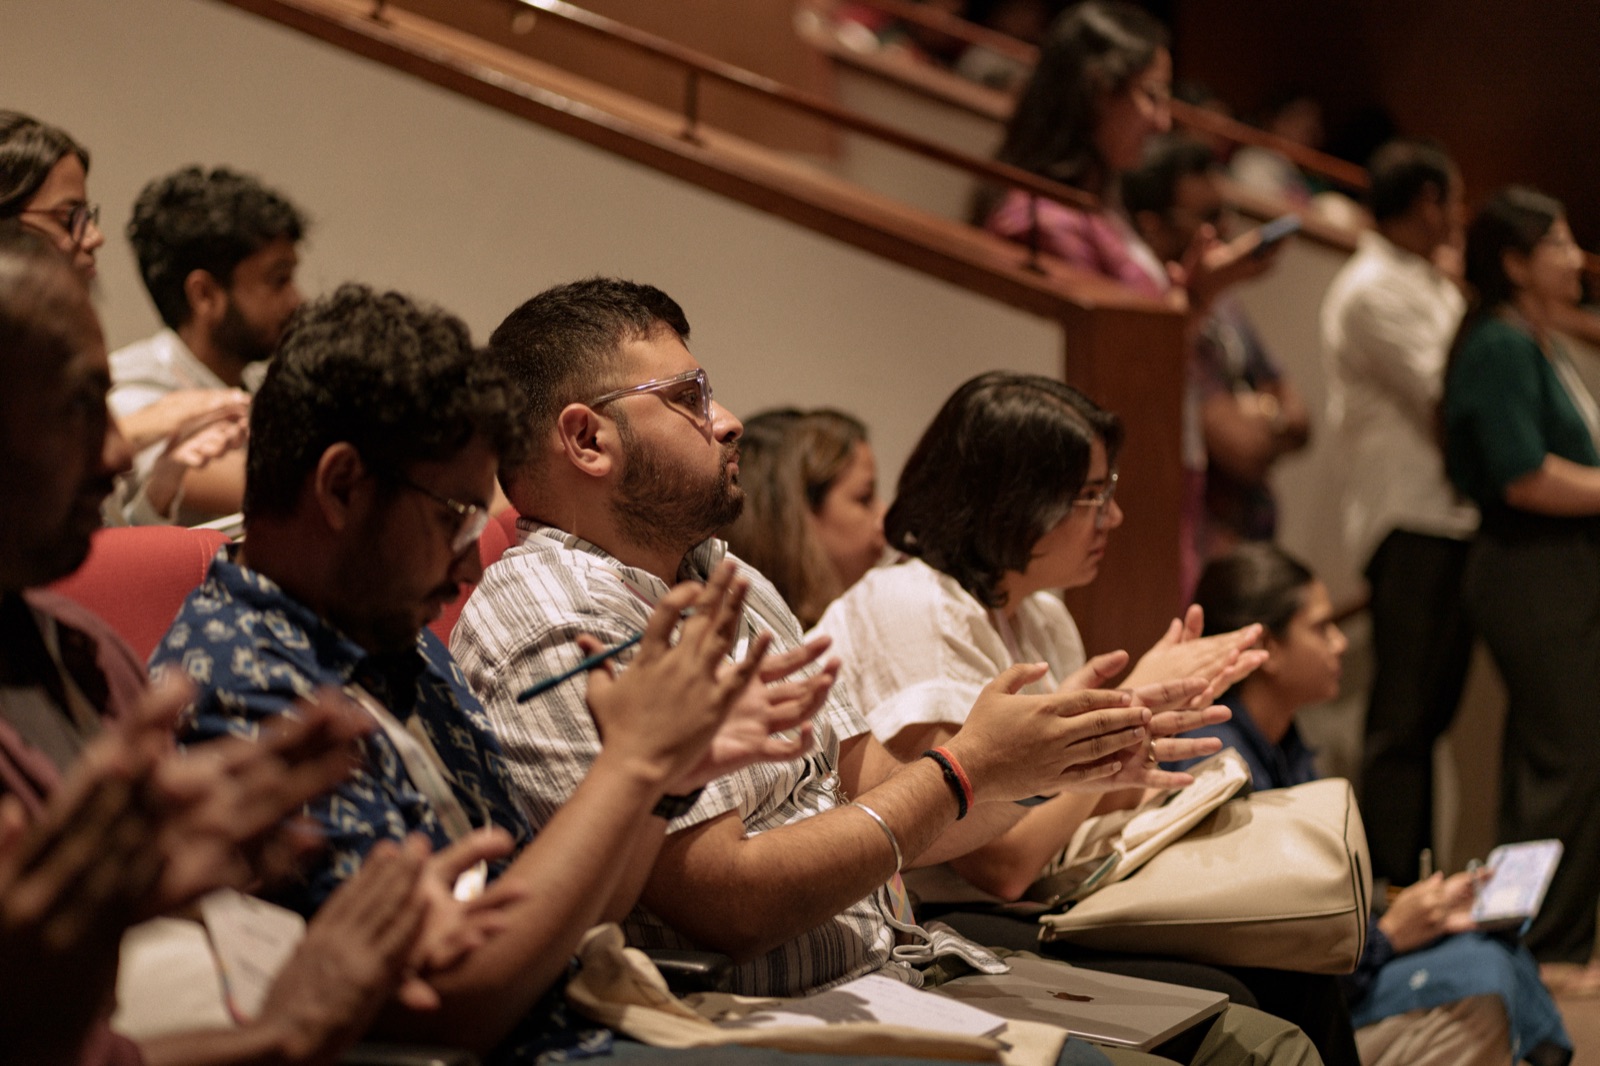
“Attending this conference was truly eye-opening—I discovered so many new ideas and perspectives that I hadn't encountered before. Unlike other events, this one stood out for its unique approach and inclusive atmosphere.”
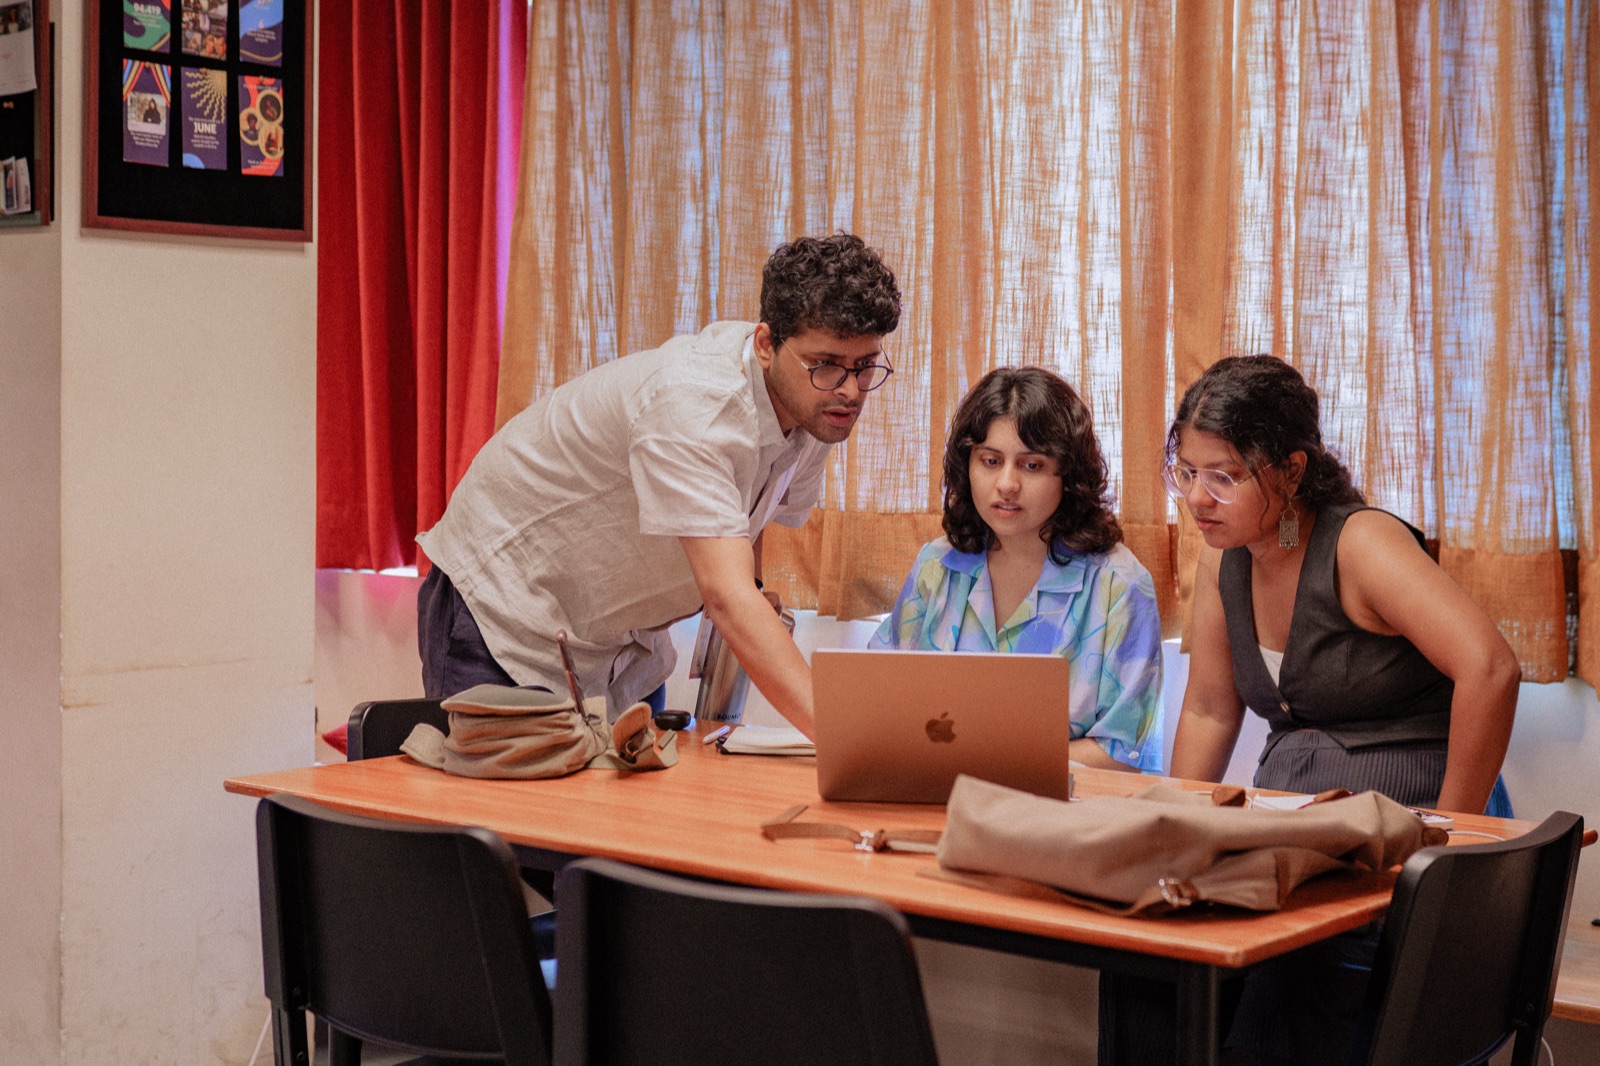
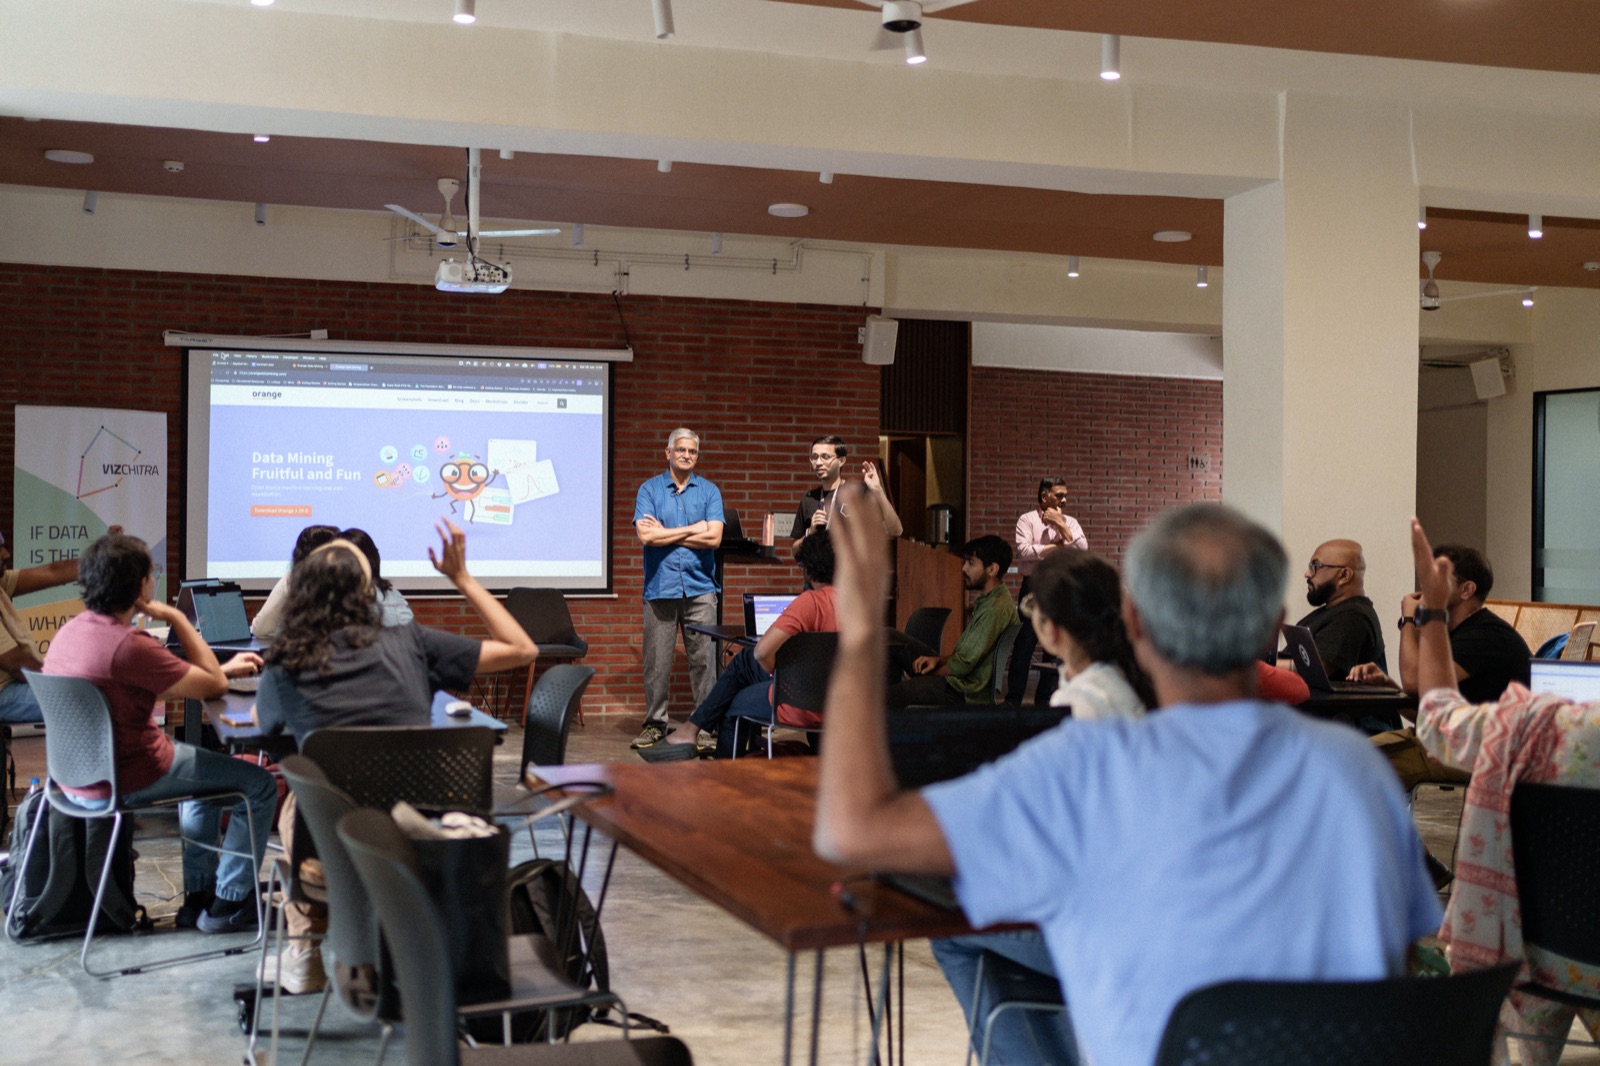
Three hours, hands-on Workshop facilitated by leading practitioners at Bangalore International Centre (BIC) & Underline Center.


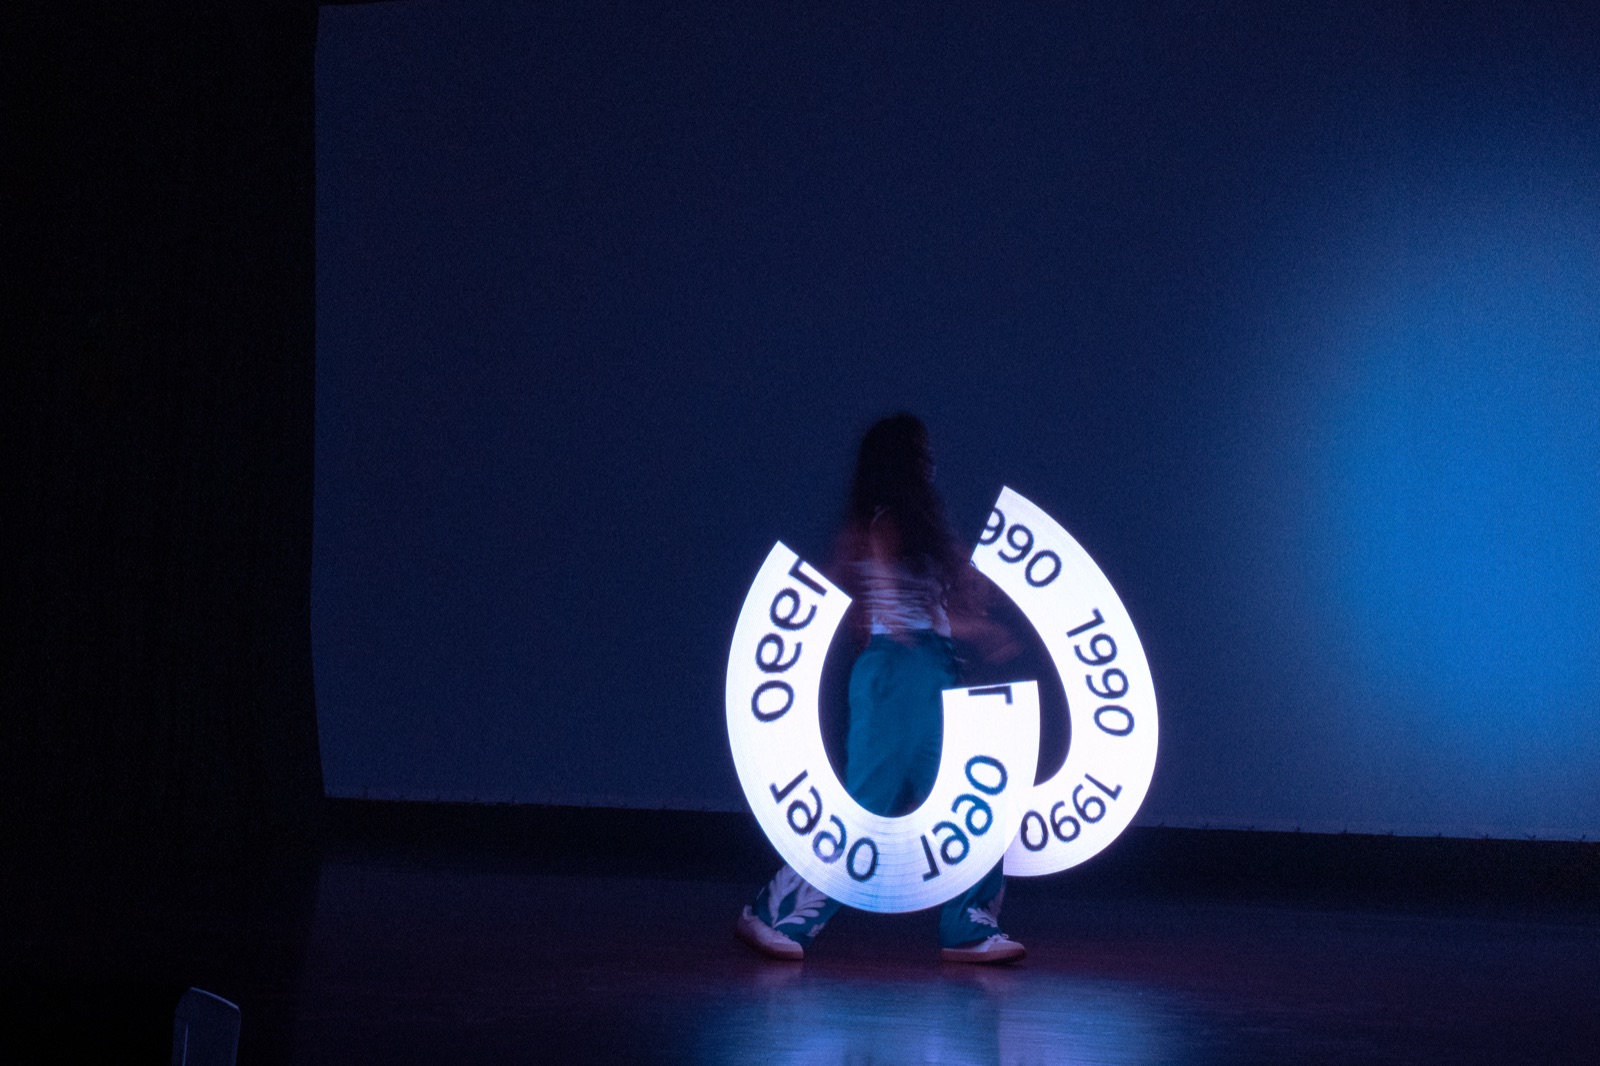
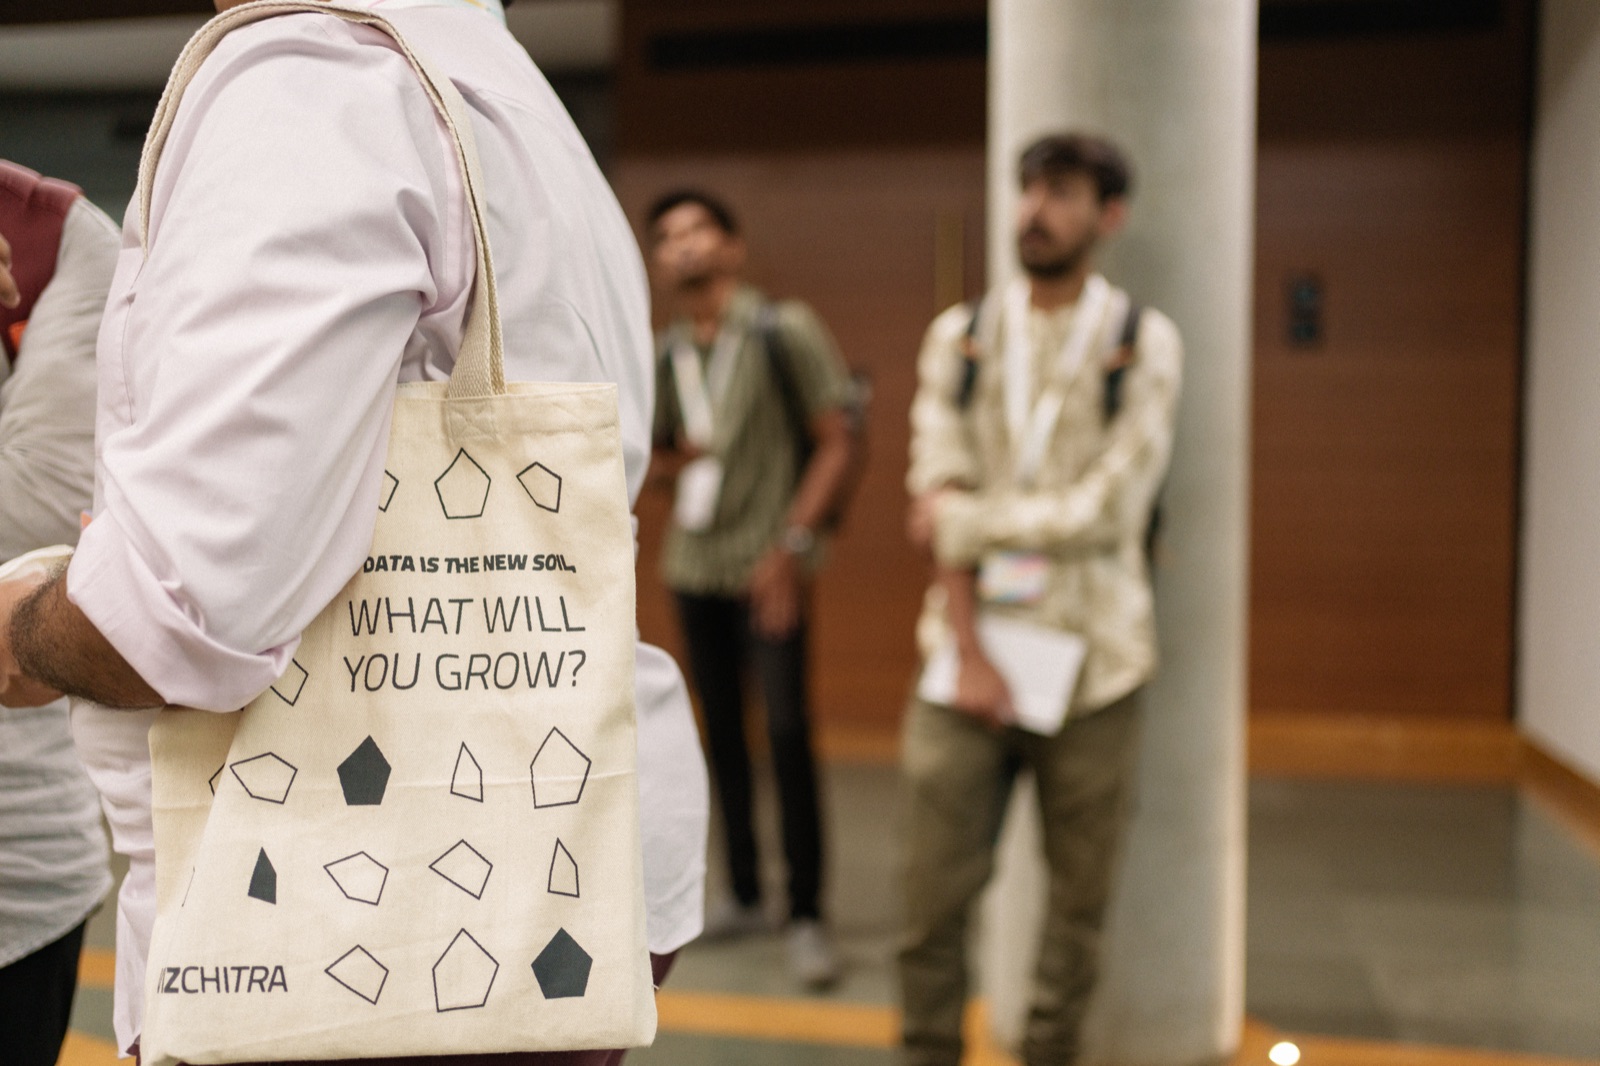
You can still catch the exhibition. Data, Otherwise, our climate and ecology data-art gallery, is open 3:00 to 8:00 PM on Friday, 3rd July with an exhibition-only pass. Come spend an unhurried evening with the work.
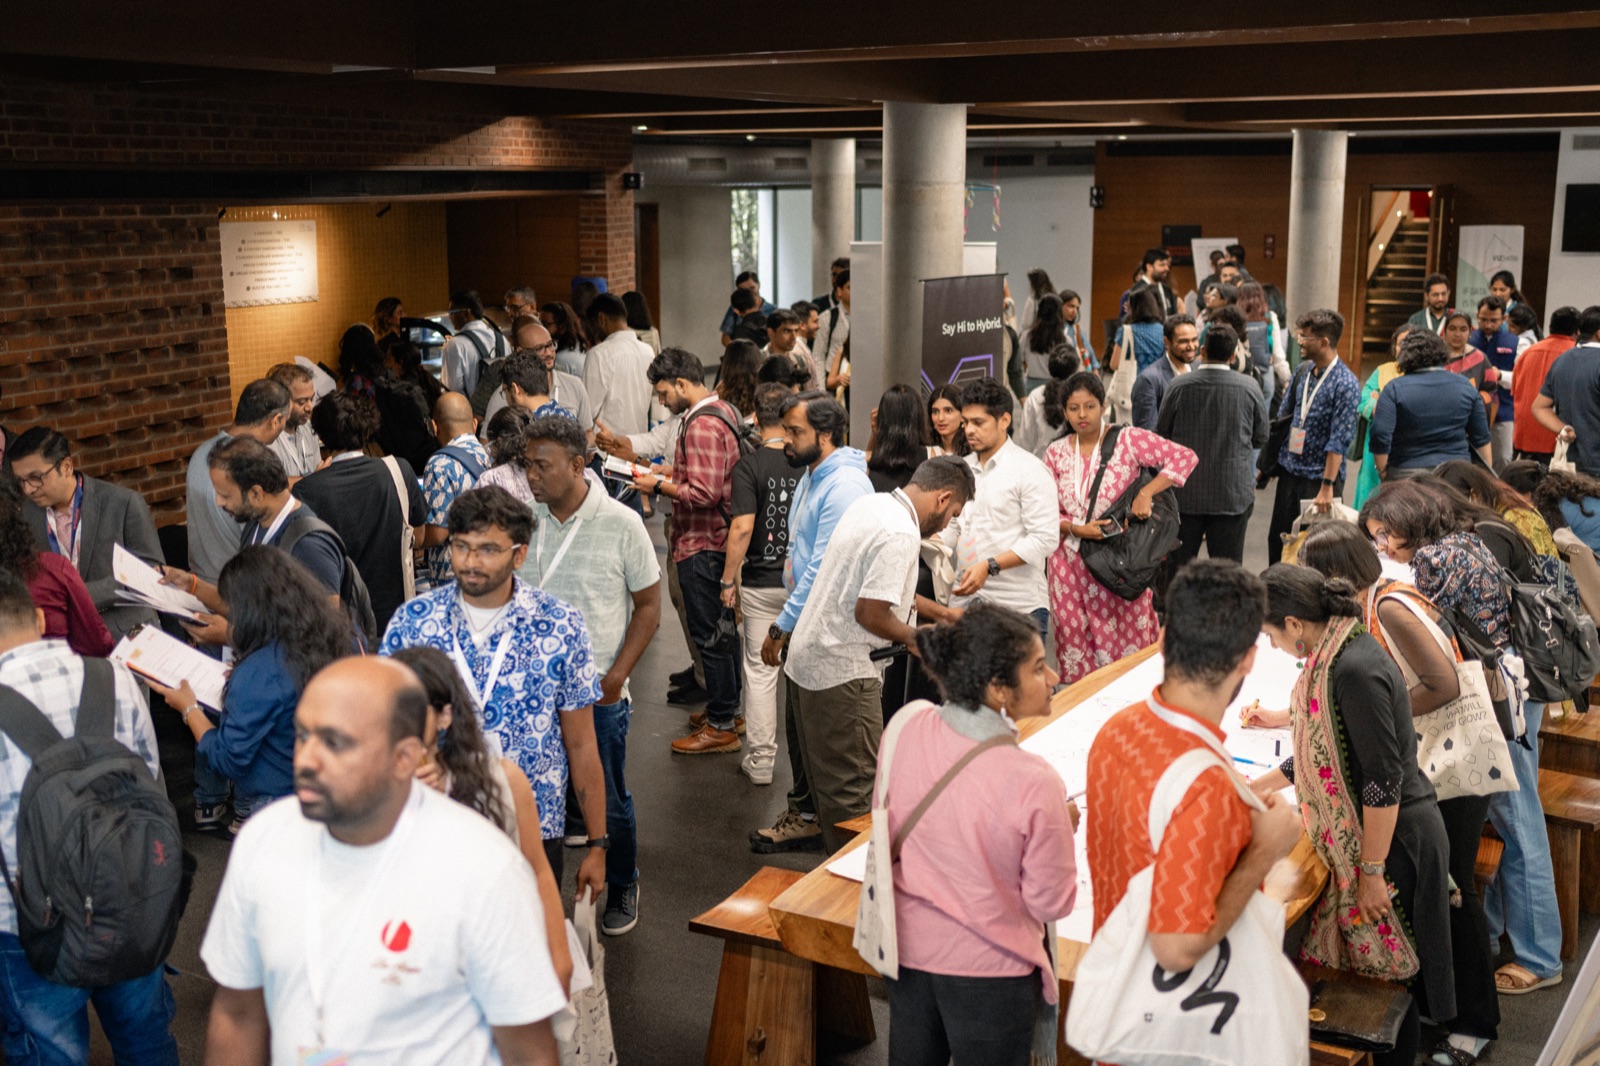
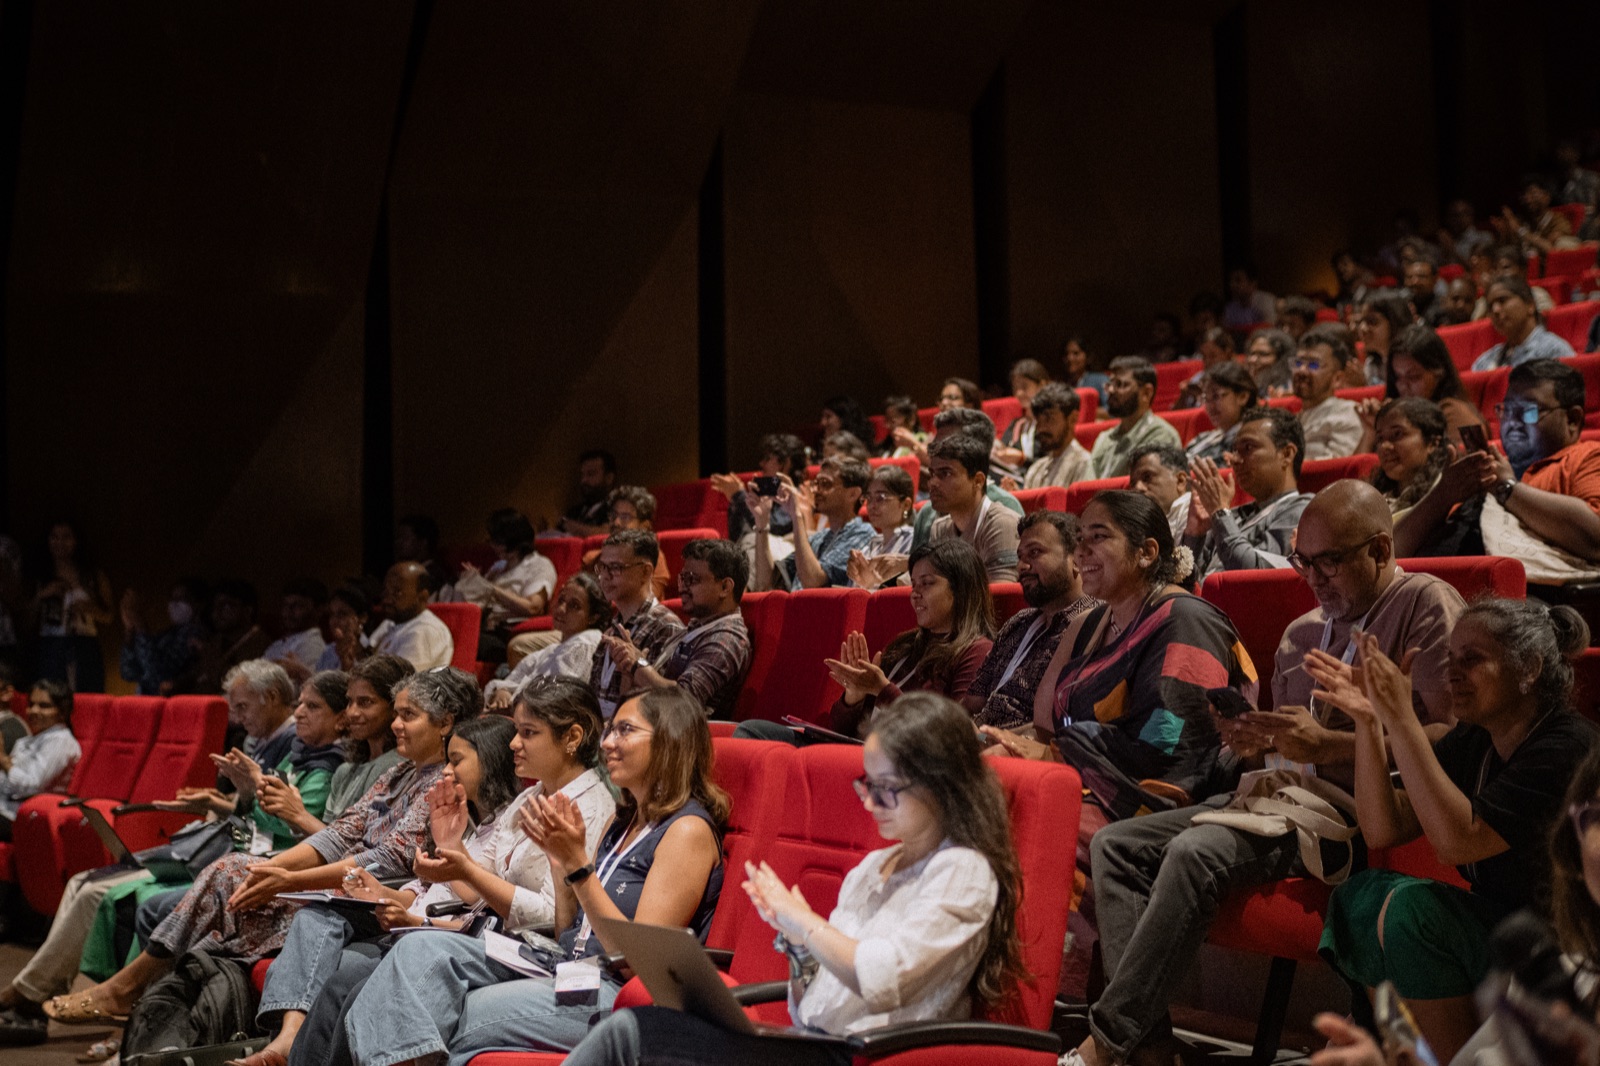
Explore the exhibition →Full day of sessions including Talks, Dialogues, Exhibition, and Activities at Bangalore International Centre (BIC), Bengaluru. Can't make it to Bengaluru? A virtual pass streams the day live.
Be there in person in Bengaluru, or join online from anywhere in the world.
Not attending but want to back VizChitra? Contribute any amount →
We received over 150 submissions across four formats—Talks, Dialogues, Workshops, and Exhibition. Browse all submitted proposals below.